Edit chart
Loading graph
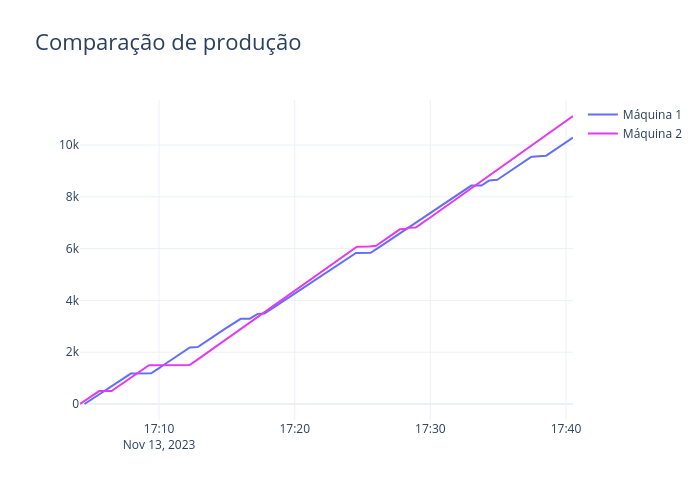
Machado.ti's interactive graph and data of "Comparação de produção" is a line chart, showing Máquina 1 vs Máquina 2; with time in the x-axis. The x-axis shows values from 2023-11-13 17:04:10 to 2023-11-13 17:40:31. The y-axis shows values from -617.7777777777778 to 11737.777777777777.